I am anticipating a recession, but I appreciate contrary points of view. Thus, I appreciated
this article which summarizes a longer, but unfortunately paywalled, post by an analyst in which 10 reasons are offered for why a recession won't occur:
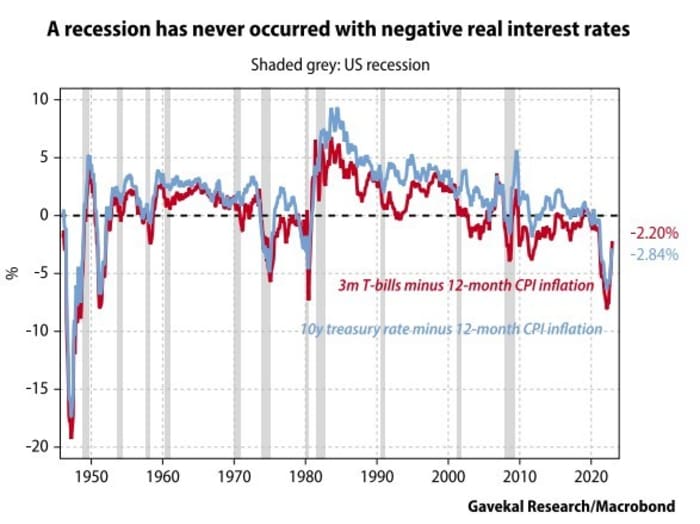
1) In the post-war era, a U.S. recession has never begun with real interest rates deeply negative across the yield curve. If we focus on the level of interest rates instead of the rate of change, this monetary tightening is still the mildest in any cycle since the 1950s.
Negative real rates are at the heart of my view on inflation. That is, negative real rates encourage people to take on debt to buy things rather than
to save, which encourages inflation, and then inflation further incentivizes people to pull ahead more purchases. However the author's "recession won't happen" call is odd because today's trend is rising interest rates and falling inflation, which means that by the later half of this year we could see deeply positive real rates. I'm not predicting a recession will start this month or next, I'm predicting it will start later this year or early next year after we see real interest rates around +2%.
The associated chart actually shows that recessions tend to start right after real rates flip suddenly from negative to positive, as in 2008 and several other points identifiable on the chart (49, 53, 74, 80). Recessions are associated with both rising interest rates and a sudden drop in inflation, which produces increasingly positive real interest rates. The two things often co-occur, but history shows a period of negative real rates does not rule out recession a short while later.
In practical terms, this method of predicting or debunking recessions is useless, because by the time we notice steep disinflation (as in 2008 or 2001) we're already in a recession and any long stock positions have already absorbed major losses. I just don't see a pattern here that gives a clear and advance signal. Instead, this is one of those things which appears obvious in hindsight.
2) Real long rates will remain negative even after the Fed funds rate reaches 5%. The U.S. yield curve is so deeply inverted that real long rates will remain negative even if inflation falls below 5% unless the curve rapidly disinverts. Neither of these events is likely in the months ahead.
This statement underestimates the volatility of CPI. Imagine how unlikely it seemed in June 2022 to say that the 12-month rate of inflation would fall 3.6% in the next 6 months. It did, and now annualized CPI is 6.35%. What would happen if 12-month CPI fell another 3% in the next few months? The answer is we'd have deeply positive real rates by this summer.
3) Yield curve inversion is not a useful recession indicator. Inversions preceded all U.S. recessions since 1970, but there were several false or very premature predictions (in 1966, 1978, 2006 and 2019, unless you believe that COVID came from Wall Street, not Wuhan).
So we have this great way of predicting recessions with very high reliability and plenty of advance notice and you're going to call it not useful because 2 years' advance notice is "premature"? Exactly what would be acceptable? A predictor with three months' lead time and a 100% reliability? That doesn't seem to exist. Saying there were "several false or very premature predictions" is deceptive when all but one of these "several" predictions are considered "premature" because a line was drawn in the sand and labeled "premature".
4) The U.S. labor market is too strong for a recession.
The
unemployment rate is usually low right before a recession. I.e. right before a recession "the bottom is in" on the unemployment rate. Moving on.
5) Aggregate real income has grown even while average real wages have fallen. Thats because rapid employment growth has more than offset the decline in real wages.
First, we know the unemployment rate can and typically does quickly zoom up during a recession, so let's not assume "rapid employment growth" is some permanent thing that must still exist 6 or 12 months from now. Second, the "real income has grown" statement refers to the last few months on some very zig-zaggy charts.
Real Median Household Income, an annual series, has been falling since the 2019 high of $72,808.
Real Disposable Personal Income, a monthly metric, is still lower than it was in February 2020. Real Disposable Personal Income is up 1.6% in the past 6 months, but it's still down 1.75% since December 2021.
6) Real wage growth will soon turn positive. With the labor market still extremely tight, wage gains should continue above 5% for the next few months while price inflation should ease to below 5%, unless there is another oil shock.
"should" + "should" = just another forecast. Besides, what is the connection between the fulfillment of these two conditions and there not being a recession? Recessions usually start during periods of positive real wage growth. It is the recessions themselves which turn this metric negative.
7) The stock of personal savings is still far above normal, thanks to government COVID handouts and cutbacks in consumption during lockdown. The order of magnitude is generally agreed to be $1-2 trillion, equivalent to between 5% and 12% of U.S. household consumption.
I've looked for a reliable source on the question of how much stimulus money / excess savings households are still hoarding. There are a lot of opinions, so there is nothing "generally agreed". I suspect it's not a lot considering how it's been well over a year since the last stimmie check was mailed. Also, if householders are doing so well, why did a
December 2022 survey find that 57% of Americans lacked the savings to cover a $1,000 expense, and 25% - the highest percentage since 2014 - would go into credit card debt if they had an unexpected $1k expense?
Household Net Worth fell 4.72% in the first three quarters of 2022.
Finally, I suspect helicopter money amounting to 5-12% of household consumption evaporated a long time ago because inflation has absorbed more than that amount. To visually see the impact of inflation, I charted personal income vs. real personal income. Even though personal income is rising, real income has been flat since 2021. The widening gap between the two represents the bite that inflation is taking out of consumers' income. I think it's safe to say this gap is larger than the stimulus payments, which means people are worse off in real terms despite the payments which ended in 2021. Since January 2021, the real personal income minus personal income calculation reveals $2.536 trillion of workers' wages (in 2012 dollars!) have evaporated due to inflation. And high inflation is continuing for at least a few more months. There went the stimulus!

8) Housing is now stabilizing. Todays 30-year mortgage rate is lower than at any time in U.S. history before the 2004-07 housing bubble.
This is putting a brave face on a
Housing Affordability Index that has just risen a tiny amount above record lows. Additionally,
Housing Starts have been plummeting since April 2022. A rapid fall in Housing Starts has preceded 7 of the 8 recessions since 1959, across a wide variety of mortgage rate levels.
9) Activity is shifting from goods to services. Big losses in manufacturing are compensated by smaller gains in the much larger service sectors. The net result is that the economy continues to grow.
I see no correlation between
Manufacturing New Orders and recession. I also see nothing to suggest that service sector growth at a faster rate than manufacturing is a good or bad thing. Basically we're back to the issues raised above: The economy always grows before a recession, otherwise the recession would already be occurring!
10) A U.S. recession in 2023 is too good to be true. If a mild U.S. recession happens this year, as most investors now expect, it will prove that Goldilocks, the Magic Money Tree and immaculate disinflation are serious economics, not just myths and fairy tales. If so, we will all have to reconsider what we thought we knew about fiscal prudence, sound monetary management and difficult political trade-offs.
I don't see the point being made here. Reading between the lines, perhaps the original author was saying something like when ALL the recession warning indicators are going off, the only thing that can happen is the impossible. E.g. the economy must avoid recession because all the signals are so deceptively clear and everyone is piling into one side of a trade, so to speak.
My doubts about this claim relate to consumer and business expectations. If everyone expected a recession, it would become a self-fulfilling prophecy. Consumers would cut spending and increase their savings in anticipation of layoffs. Businesses would reduce their inventories, order less from manufacturers, and preemptively lay off employees. None of these things are happening yet, which suggests most economic agents are not preparing for a recession. Neither businesses nor consumes are piling into one side of a trade by doing the things they should do in advance of an expected recession.
If they did make changes in anticipation of a recession, those changes would themselves cause the recession. This is where the crowded trade metaphor breaks down. Crowded trades push prices away from what the crowd expects. Recession expectations push the economy toward recession.
----------------------------------------------------------
At the bottom of the same article, it's noted that Anthony Scaramucci said on Twitter that the S&P500 has gone 18 sessions above it's 200-day moving average, and that has always in the past signaled the end of a bear market. Another poster noted that the S&P500 was higher 100% of the time 3 months after this pattern occurred, after at least a 20% decline:
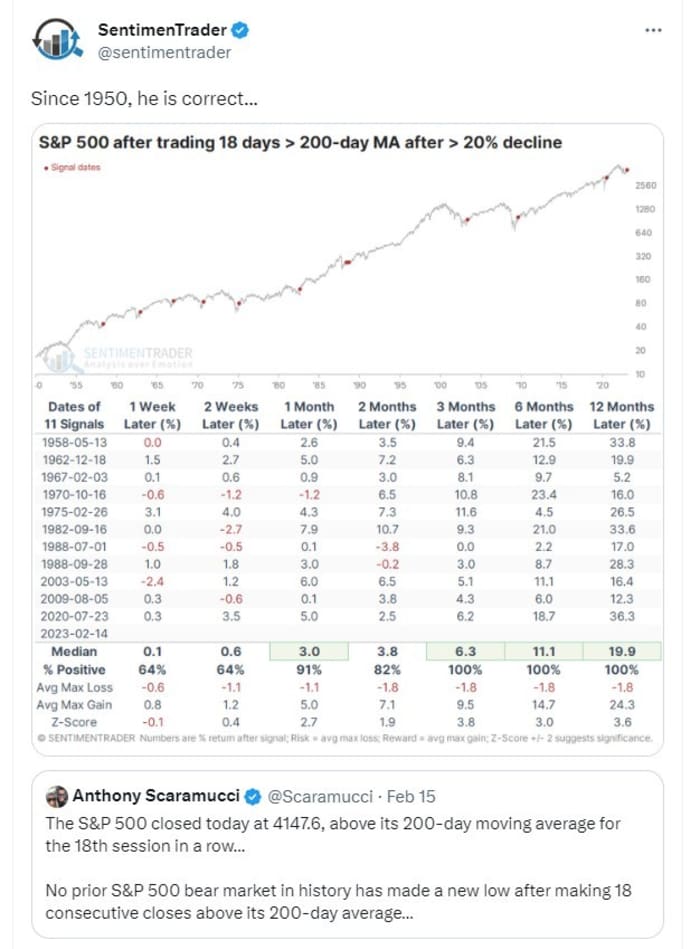
First, why are we picking 18 days? Is that the cherry in the data? How does the reliability break down at 15 days or 22 days?
Second, what mechanism forces stocks higher after precisely 18d above the MA? Compelling values? Not at today's near-22 PE ratio for the S&P500, amid rising bond yields.
I'm a big fan of pattern identification, but this looks an awful lot like cherry-picked technical analysis. Bear market rallies in the 10%-15% range are typical, and it seems inevitable that at least some of these would poke above the X-day moving average for Y-days.


