The
Unreliability of long run stock market returns discussion included a simple stock market Monte Carlo simulation spreadsheet. But it looked at 100-year long accumulations.
I thought it might be useful to create another simple but more applicable simulation spreadsheet... so did that. Anyone interested can grab that spreadsheet here:
https://evergreensmallbusiness.com/wp-content/uploads/2017/11/TenSimulations40YearAccumulations.xlsxAs title indicates, the simulation looks at 40 year long accumulations. To keep the spreadsheet to a manageable size, it only recalculates ten scenarios at a time but one can press the F9 (recalculate) key several times to see a bunch of iterations.
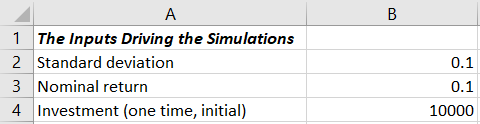
To use the spreadsheet, you enter a standard deviation, nominal return and initial deposit into the worksheet:
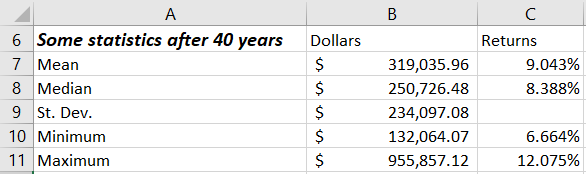
The spreadsheet calculates some familiar values:
And then most useful, probably, it draws a line chart of the scenarios to show you the ways things could turn out:
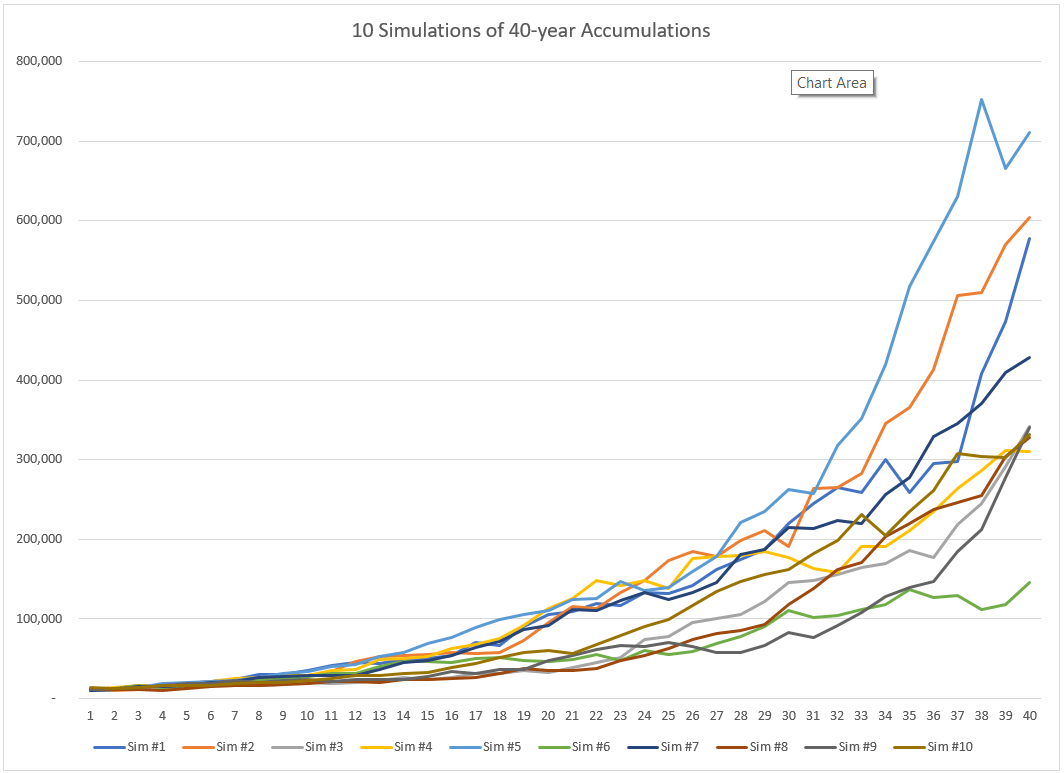
The spreadsheet is very simple. But if someone enters a decent long-run estimate of their portfolio's nominal (so
unadjusted for inflation) return and their portfolio's standard deviation, they can look at the statistics and especially at the chart and get a gut-level feel for the sort of variability they could easily see.
Note: The initial inputs and the example spreadsheet values show a 10% nominal return and 10% standard deviation. These are the FIRECalc default values for doing a simulation. But I think 9% and 9% are probably better if one models the classic 60% stocks and 40% bonds asset allocation. I would think looking at a 100% stocks portfolio would mean something more like 10% return and 15% standard deviation.
Tip: The thing to really play with if someone wants to noodle around here is that standard deviation value. We are all pretty good, I think, at thinking about the annual return value. But many of us (me included) seem to sometimes kind of "glance over" the standard deviation.
P.S. If someone is interested, I did describe the steps to create this spreadsheet at my blog, link appears in sig.


