Rolling averages are a slight refinement, mostly offering greater granularity, not any vast improvement in spotting multi-decade trends. Yes, the stock market trends up in both nominal and real terms over time.
The article does not disclose whether the percentage returns are calculated in real or merely nominal dollars and when that is left out of the story I assume the returns are nominal. I suppose I could go back and re-work their numbers from scratch to figure out if that assumption is correct, but I'm not a peer-reviewer and so I won't.
To say that an investor who went all-in on exactly September 3, 1929 (on no margin and evenly spread across every common stock on the Dow (I know, I know, the DJIA is not the S&P 500, exactly) ) had broken even by 1949 misses the mark by about eight years and ignores the time value of money entirely. It also misses the churning in the companies that compose the indexes. Some good chunk of those had been liquidated in the twenties and thirties and been replaced by growing companies that our hypothetical 1929 investor had no position in.
Using the CPI as a decent proxy for the time value correction, by 1949 the purchasing power of the dollar had slipped by about 39%. Wait for the Dow to hit around 520 instead of 380 would require waiting until about 1960 at the earliest. Meanwhile purchasing power slid another 24.4%...
What's the point? This is a worst case scenario, and that is very unlikely to occur more than once, not in a lifetime but ever again. And I don't think people should plan their affairs focused on the least likely events as if they were the most likely. I guess I'm just aggravated at sloppy reasoning in financial journalism. But if I rise to that bait every time it is offered, I'll have nothing else to do.
So,now back to your regularly scheduled and half-baked programming.
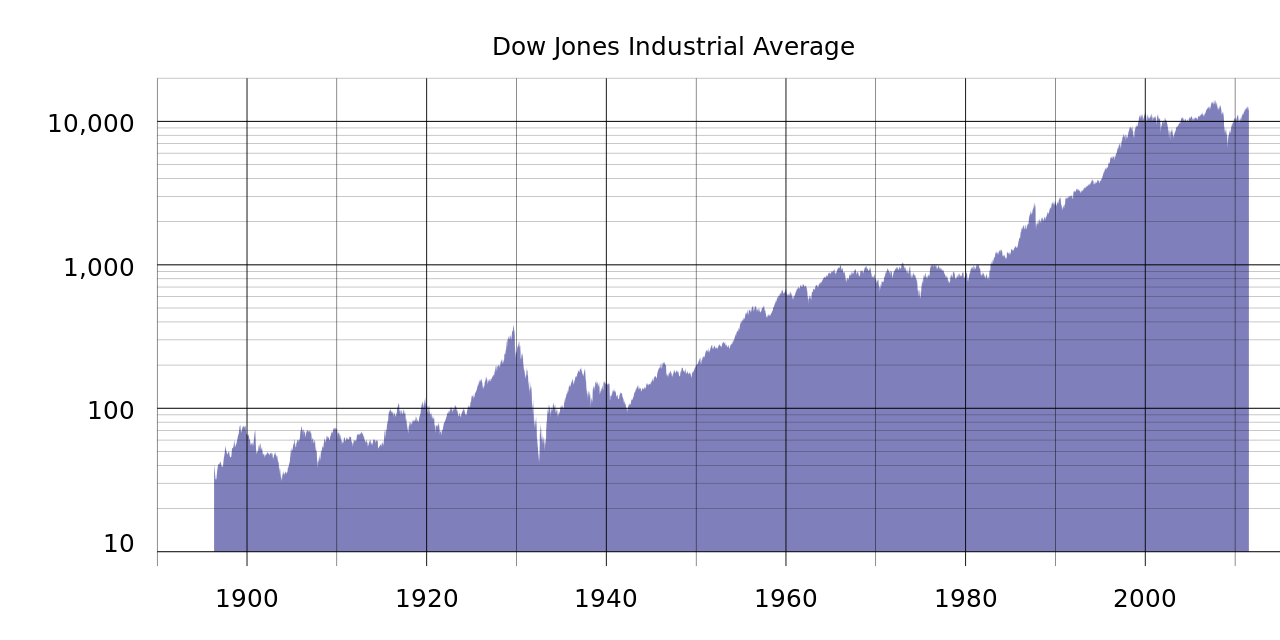
WARNING: Not adjusted for anything