You have to make some assumptions:
1) The
real (i.e.,
not including inflation) return you will get on your investments. Guess correctly and all is well. Guess too high and you'll run out of money. Guess too low and you'll work "too long".
2) When you will retire. That choice may be made for you, or you may change your mind in either direction.
3) The withdrawal rate you will use (and that will work). 4% is a "not unreasonable" guess.
Given the assumptions above, divide your expected spending (in today's dollars) by the withdrawal rate. E.g., $25K/0.04 = $625K.
Then you project how many years of some annual contribution you need until you can stop contributing and let compound growth alone take it the rest of the way.
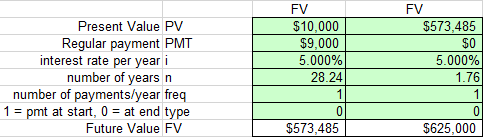
E.g., if you
- have $10K in the account now
- expect to contribute $9K/yr
- expect to retire in 30 years
- expect to earn 5% real
then you would need to contribute for a little over 28 years. See the 'Misc. calcs' tab of the
case study spreadsheet.
The picture below shows columns A-D and rows 16-23. Entries in the green cells are numbers, except for cells
D17: =C23
D20: =30-C20
One could adjust cell C20 by hand, or use Data>What-If Analysis>Goal Seek... to set cell D23 to 625000 by changing cell C20.
Does that make sense?

